كيفية قراءة أسواق إيران باستخدام هرمز
دليل عملي لإشارات السوق الحالية، وتقييمات بالدولار الأمريكي، والمعلومات الاستخباراتية الموجهة لاتخاذ القرارات
ليست صعوبة فهم سوق إيران ناتجة عن غياب المعلومات بالكامل، بل تنبع المشكلة الأعمق من أن المعلومات المتاحة نادراً ما تُنظَّم حول الأسئلة ذات الأهمية.
لا يخبرنا المؤشر المرتفع ما إذا كان الصعود شاملاً لمعظم الأسهم. كما أن القيمة السوقية الكبيرة لا توضح مدى سهولة تداول تلك القيمة. وقد تتلاشى المكاسب الاسمية بالريال عند تقويمها بالدولار. وقد يتوفر طلب محلي قوي في حين تجعل آليات الدفع أو التنظيمات أو صعوبة الوصول إلى السوق من تنفيذ الفرصة أمراً معقداً.
تعالج بيئة عمل أسواق هرمز (Hormuz Markets) هذه المشكلات المختلفة من خلال عرضين مكملين لبعضهما:
Market Navigator يساعد المستخدمين على دراسة السوق من خلال هدف محدد وأفق زمني معين.
Tehran Market Daily يقدم قراءة حالية لسوق الأسهم المدرجة في إيران بعد إغلاق الجلسة.
يبدأ أحدهما بالقرار، بينما يبدأ الآخر بأحدث أدلة السوق. وعند استخدامهما معاً، يساعدان على الانتقال من الإشارة الرئيسية إلى تفسير أكثر موثوقية وقابلية للدفاع عنه.
ما العرض الذي ينبغي لك استخدامه؟
استخدم Market Navigator عندما يكون سؤالك استراتيجياً:
- هل هذا السوق ذو صلة بأطروحة استثمارية؟
- ما هو المسار الأكثر عملية لدخوله؟
- هل يمكننا البيع فيه أو التوريد منه؟
- ما هي المخاطر التي يجب مراقبتها قبل اتخاذ القرار؟
استخدم Tehran Market Daily عندما يتعلق سؤالك بسلوك السوق الحالي:
- هل كانت حركة السوق الأخيرة واسعة النطاق أم محصورة؟
- ما حجم السيولة التي كانت متاحة؟
- هل كان المستثمرون الأفراد المحليون يشترون أم يبيعون؟
- هل كانت رؤوس الأموال تتجه نحو الأسهم أم الدخل الثابت أم الذهب؟
- ما القطاعات التي قادت الجلسة؟
- ما هي قيمة السوق المدرجة بالدولار الأمريكي الحالي؟
هذا التمييز مهم؛ فالجلسة التداولية القوية لا تثبت إمكانية الوصول إلى السوق أو الاستثمار فيه، كما أن الجلسة الصعبة لا تلغي بالضرورة فرصة استثمارية سليمة على المدى الطويل.
Market Navigator: ابدأ بالقرار
يبني Market Navigator تحليله على ثلاثة خيارات:
- السوق؛
- الهدف؛
- الأفق الزمني.
يتيح هذا الهيكل تفسير السوق نفسه بشكل مختلف بناءً على ما ينوي المستخدم القيام به.
اختر السوق
تنظم هرمز الاقتصاد الإيراني من خلال عدسات سوقية مثل:
- النقد الأجنبي;
- أسواق المال;
- المصارف والائتمان؛
- الأصول الحقيقية;
- الطلب الاستهلاكي;
- طلب الشركات;
- التجارة والعبور؛
- المشاريع العامة.
يتجاوز هذا مجرد اختيار فئة؛ فهو يحدد البيئة الاقتصادية المحيطة بالقرار.
إن الشركة التي تختار طلب الشركات قد تحتاج إلى دراسة المشترين الصناعيين، ودورات المشتريات، واحتياجات الاستبدال، وتركيز المشترين.
أما المستخدم الذي يختار النقد الأجنبي فيطرح مجموعة مختلفة من الأسئلة: التعرض لتقلبات العملة، ومسارات التسوية، وتكاليف المدخلات المستوردة، وتحويل العوائد بالريال إلى قيمة اقتصادية.
تحدد عدسة السوق الصحيحة الإشارات المهمة والمخاطر التي تستحق الأولوية.
حدد الهدف
يمكن للسوق نفسه أن يبدو جذاباً لغرض وغير مناسب لغرض آخر. ولذلك يفصل Market Navigator بين عدة أهداف.
الاستثمار
يركز منظور الاستثمار على التقييم، والجدوى الاقتصادية المعدلة حسب المخاطر، والسيولة، والأدلة، والتنفيذ.
فهو يتساءل عما إذا كانت العوائد الظاهرة تظل ذات مغزى بعد أخذ التضخم وآثار العملة في الاعتبار، وعما إذا كان من الممكن الدخول في هذا التعرض والخروج منه، وما هي الأدلة التي تدعم هذه الفرضية.
دخول السوق
يركز هذا المنظور على الوصول العملي.
فهو يوجه الانتباه نحو الترخيص، والشراكات، والتسوية، والبنية التحتية، والمسار الأقل مخاطرة الذي يمكن من خلاله الوصول إلى الفرصة بالفعل.
البيع
يركز منظور البيع على الطلب القابل للوصول بدلاً من حجم السوق النظري.
فهو يأخذ في الاعتبار المشتريين، وقنوات المشتريات، والتوزيع، وتوقيت الدفع، ومتطلبات الخدمة، وتأثير ظروف العملة على الهوامش.
التوريد
تم تصميم منظور التوريد لبحوث الموردين والقدرات الاستيعابية.
فهو يولي أهمية أكبر للاستمرارية، والجودة، والخدمات اللوجستية، والموسمية، ومخاطر التركز، وموثوقية الطرف المقابل.
الحفاظ على رأس المال
يتساءل هذا الهدف عما إذا كان التعرض يمكنه الاحتفاظ بالقيمة الاقتصادية بعد التضخم، وانخفاض القيمة، وقيود السيولة، وتكاليف الخروج.
قد تظل الزيادة الاسمية بالريال تمثل خسارة بالـ USD أو بالقدرة الشرائية الحقيقية.
مراقبة المخاطر
يحدد هذا المنظور التطورات التي قد تغير التسعير، أو الوصول، أو الطلب، أو التنفيذ.
فهو يحول القلق العام إلى إطار عملي للمراقبة.
حدد الأفق الزمني
تقسم Hormuz ثلاث فترات:
- الظروف الحالية؛
- من ستة إلى اثني عشر شهراً؛
- من سنتين إلى ثلاث سنوات.
يولي المنظور الحالي أهمية أكبر للسيولة الفورية، والتسوية، والطلب، والاحتكاك التشغيلي.
يعتبر المنظور متوسط الأجل أكثر حساسية لإعادة التسعير، وآثار السياسات، ومرونة الطلب.
يمنح الأفق الأطول أهمية أكبر للبنية التحتية، والقدرة الإنتاجية، والتنظيم، والمكانة التنافسية المستدامة.
وهذا يمنع الخلط بين الاضطراب المؤقت والضعف الهيكلي. كما يمنع استخدام فرضية جذابة طويلة الأجل للتغاضي عن مشكلات التنفيذ الفورية.
كيفية تفسير مخرجات Navigator
والنتيجة ليست درجة تقييمية ولا توصية. بل هي تفسير منهجي للقرار المختار.
يقدم القسم الأول فرضية سوق مختصرة، وإشارة رئيسية، وإشارة ثانوية، والتوجه المناسب.
قد يبدو السوق جذاباً ولكنه حساس للتنفيذ، أو واضحاً ولكنه ضعيف السيولة، أو مجزأً ولكنه غني بالفرص، أو ذا صلة فقط في ظل ظروف انتقائية.
ثم تقوم Hormuz بتقييم عوامل مثل:
- التعرض للعملات؛
- كثافة رأس المال؛
- السيولة؛
- الاحتكاك التنظيمي؛
- وضوح البيانات؛
- الوقت المستغرق لتحقيق الإيرادات.
تساعد هذه العوامل في الكشف عن نقطة الاختناق.
يمكن للسوق أن يظهر طلباً قوياً مع البقاء صعب التحقق. وقد يقدم سوق آخر أسعاراً واضحة ولكن بسيولة محدودة. وقد تواجه الفرصة قليلة الكثافة الرأسمالية دورات دفع طويلة أو عقبات تنظيمية.
الغرض ليس اختزال السوق في رقم واحد. بل إظهار أين قد يفشل القرار.
الإشارات والأولويات والأدلة
يحدد Navigator الظروف التي تستحق الاهتمام ثم يترجمها إلى أولويات بحثية عملية.
في طلب الشركات، على سبيل المثال، قد تشمل الإشارات ذات الصلة إحلال الواردات، وضغط الصيانة، وتركز المشتريين.
إحلال الواردات قد يخلق طلباً، ولكن فقط حيث تظل الجودة والخدمة والتسعير مجدية.
ضغط الصيانة قد يكشف عن طلب متكرر مرتبط بالقاعدة الصناعية القائمة بدلاً من المشاريع الجديدة وحدها.
تركز المشتريين قد يسهل الوصول إلى السوق مع زيادة القوة التفاوضية ومخاطر الطرف المقابل.
يحول القسم التالي هذه الملاحظات إلى تسلسل عملي:
- اختبار الجدوى الاقتصادية؛
- فحص التنفيذ؛
- العثور على الأدلة.
هذه هي القيمة الرئيسية لـ Navigator. فهو لا يكتفي بوصف السوق. بل يساعد في تحديد ما يجب التحقق منه قبل أن يصبح القرار موثوقاً.
معلومات استخباراتية مترابطة
يربط Market Navigator المنظور المختار بالرسم البياني الاستخباراتي الأوسع لـ Hormuz.
اعتماداً على السوق والهدف، قد يشمل ذلك:
- قطاعات السوق ذات الصلة؛
- Market Cases؛
- المقارنات؛
- المقالات؛
- الفرص؛
- الصناعات؛
- المحافظات؛
- التحديات المتكررة.
يتيح ذلك للمستخدم الانتقال من بيان سوقي عام إلى مواقف تشغيلية محددة.
بدلاً من الاعتماد على ادعاء مثل «طلب الشركات قوي»، يمكن للمستخدم فحص الشركات، والحالات، والمواقع، والقيود ذات الصلة.
وبذلك لا يُعرض السوق كفئة معزولة، بل كشبكة من الأدلة التجارية.
Tehran Market Daily: قراءة الجلسة الأخيرة
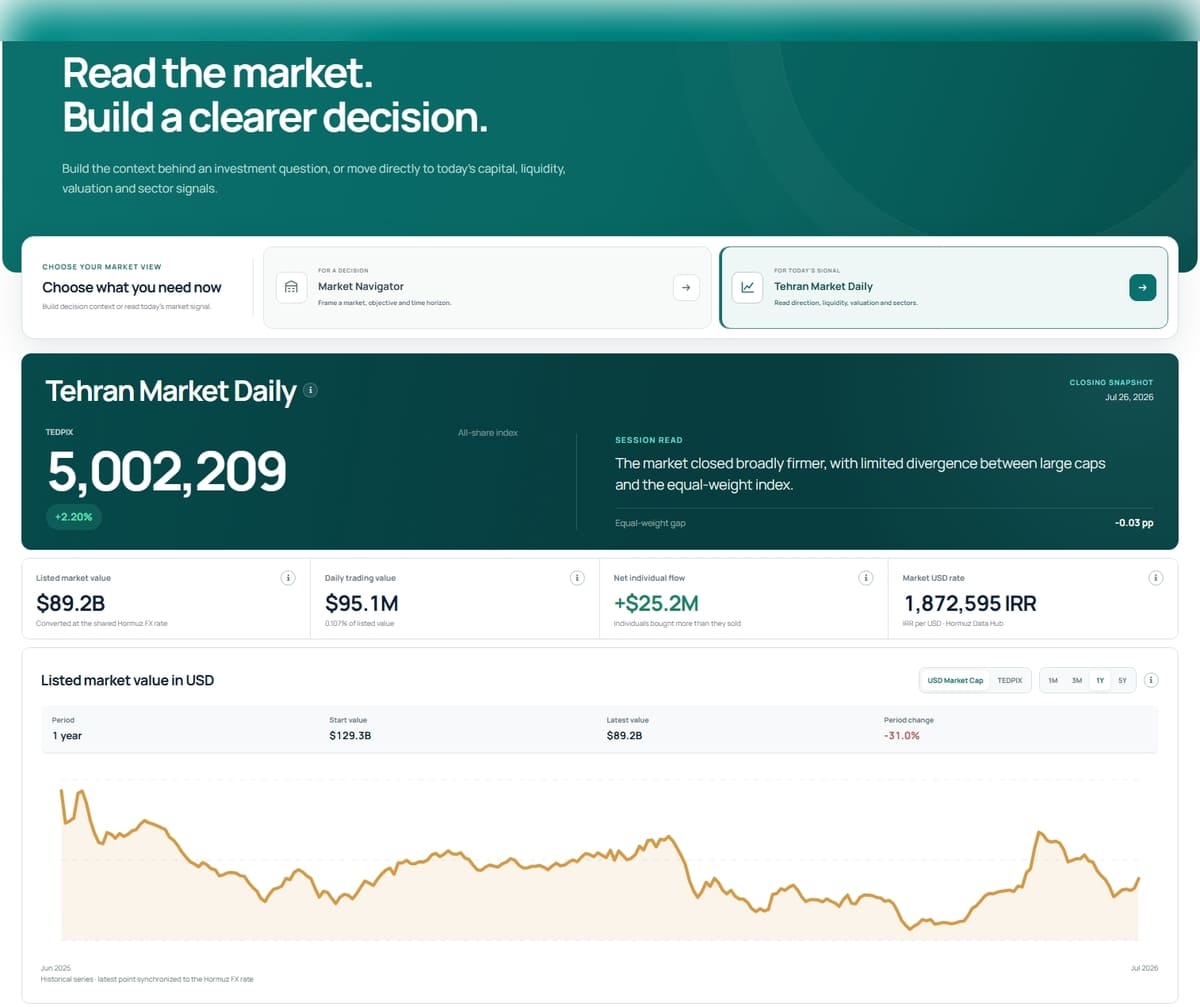
تعد صفحة Tehran Market Daily جانب البيانات الحالية لمنطقة عمل Markets.
وهي تجمع بين:
- السعر؛
- اتساع السوق؛
- السيولة؛
- عدم التوازن في أوامر الإغلاق؛
- التقييم؛
- تدفق المستثمرين؛
- تدوير رأس المال؛
- ريادة القطاعات.
تعرض الصفحة البيانات باللغة الإنجليزية وتحول قيم الريال الحالية من خلال سعر صرف موحد في Hormuz Market Data Hub.
وينبغي قراءتها كإشارة سوقية متزامنة لما بعد إغلاق الجلسة. وهي لا تؤكد أن المستثمر الأجنبي يمكنه الوصول إلى ورقة مالية محددة أو حفظها أو إعادة أموالها إلى الوطن.
الاتجاه الرئيسي وجودة الجلسة
تبدأ لوحة التحكم بـ TEDPIX، وهو المؤشر الرئيسي المرجح بالقيم السوقية لـ بورصة طهران للأوراق المالية.
تظهر التغير المئوي اتجاه الجلسة الأخيرة، لكن مؤشر TEDPIX وحده قد يكون مضللاً لأن الشركات الأكبر حسماً وتأثيراً على المؤشر.
ولذلك تضيف Hormuz قراءة الجلسة، مع مقارنة التحرك الرئيسي بمؤشرات أوسع مثل المؤشر متساوي الأوزان (Equal-Weight).
يجيب هذا عن سؤال أكثر فائدة:
هل كان تحرك السوق واسع النطاق أم مدفوعاً بشكل أساسي بالشركات الكبرى؟
يشير ارتفاع المؤشر المدعوم بنطاق سوق إيجابي وأداء أقوى للمؤشر متساوي الأوزان إلى مشاركة أوسع. بينما قد يشير ارتفاع مؤشر TEDPIX إلى جانب نطاق سوق ضعيف إلى أن مجموعة ضيقة فقط من الشركات الكبرى هي التي قادت السوق.
القيمة السوقية للشركات المدرجة
القيمة السوقية المدرجة هي القيمة الإجمالية للأسهم المدرجة المغطاة، والمحولة من الريال إلى USD باستخدام سعر Hormuz المرجعي الموحد الحالي.
وهي تقدم تقديراً واضحاً للحجم الملحوظ لسوق الأسهم المدرجة في إيران.
يفيد هذا الرقم في:
- مقارنة القيمة السوقية الحالية بالفترات السابقة؛
- التمييز بين النمو الاسمي بالريال والأداء بـ USD؛
- مقارنة حجم القطاعات الصناعية المدرجة؛
- وضع قيمة التداول اليومية في سياقها؛
- إجراء مقارنات دولية عامة.
وهي لا تكافئ القيمة السوقية للأسهم الحرة، أو القيمة السوقية المتاحة للاستثمار الأجنبي، أو عمق السوق القابل للتنفيذ.
قد يبدو السوق كبيراً في حين يظل من الصعب إجراء معاملات فيه على نطاق واسع.
سعر الدولار في السوق
تعتمد كل عمليات تحويل الريال إلى الدولار الحالية في الصفحة على مرجع مركز بيانات السوق (Market Data Hub) نفسه.
وهذا يحافظ على الاتساق الداخلي بين الأرقام الرئيسية والرسم البياني التاريخي وقيم القطاعات.
تعتبر طبقة تقييم USD مهمة لأن التضخم وانخفاض قيمة العملة قد يجعل تفسير الأرقام الاسمية بالريال أمراً صعباً. فقد يرتفع المؤشر المحلي بينما يفقد السوق قيمته بالدولار.
هذا السعر هو مرجع تحليلي مشترك، وليس ضماناً بأن كل مشارك في السوق يمكنه تسوية الأموال بهذا المستوى تماماً.
قيمة التداول اليومية
توضح قيمة التداول اليومية قيمة الأسهم المدرجة المتداولة خلال الجلسة.
واستخدامها الرئيسي هو تقييم السيولة والمشاركة.
قد يتمتع سوق ذو قيمة سوقية كبيرة ولكن معدل دوران منخفض بعمق عملي محدود. بينما قد يقدم سوق أصغر ذو معدل دوران أقوى اكتشافاً أكثر نشاطاً للأسعار.
لذلك، غالباً ما تكون العلاقة بين قيمة التداول والقيمة السوقية أكثر إفادة من أي من الرقمين بمفرده.
لا تمثل قيمة التداول اليومية استثماراً جديداً في المصانع أو الأصول الإنتاجية، بل تقيس المعاملات بين البائعين والمشترين في السوق الثانوية.
صافي تدفقات الأفراد
يقيس صافي تدفقات الأفراد المشتريات من حسابات المستثمرين الأفراد الإيرانيين بعد خصم مبيعاتهم.
وهو مؤشر على المعنويات المحلية والتموضع في السوق.
يعني الرقم الإيجابي أن حسابات الأفراد كانت في وضع المشتري الصافي. بينما قد يشير الرقم السلبي إلى الحذر، أو جني الأرباح، أو الانتقال إلى فئات أصول أخرى.
تصبح هذه الإشارة أكثر فائدة عند قراءتها جنباً إلى جنب مع أداء المؤشر وقيمة التداول وتدوير رؤوس الأموال.
على سبيل المثال، قد يشير ارتفاع السوق مع تدفق أفراد سلبي إلى أن القوة كانت مركزة في الشركات الكبرى أو مدعومة من فئات مستثمرين أخرى.
وهو ليس قياساً لتدفقات المحافظ الاستثمارية الأجنبية.
تاريخ السوق: المؤشر المحلي مقابل القيمة بالدولار الأمريكي
يتيح القسم التاريخي للمستخدمين التنقل بين مؤشر TEDPIX والقيمة السوقية بـ USD عبر آفاق زمنية مختلفة.
يجيب مؤشر TEDPIX عن:
كيف كان أداء الأسهم المدرجة داخل السوق المحلي؟
تجيب القيمة السوقية بـ USD عن:
ماذا حدث لقيمة السوق المدرجة المحولة إلى العملة الأجنبية؟
يمكن أن يكون الفارق كبيراً.
قد يصل السوق إلى مستوى قياسي اسمي جديد للمؤشر مع بقائه دون التقييم السابق بـ USD. بالنسبة للمستثمرين الدوليين والمستثمرين المحليين المهتمين بالقوة الشرائية الحقيقية، غالباً ما تقدم النظرة المقومة بالدولار المقارنة طويلة الأجل الأكثر مغزى.
يتم حساب أحدث نقطة بـ USD من القيمة السوقية المدرجة الحالية وسعر مركز بيانات السوق (Market Data Hub) المستخدمين في القسم الرئيسي نفسه، مما يحافظ على محاذاة الأرقام الحالية.
اتساع نطاق السوق
يوضح نطاق السوق عدد ونسبة الرموز المتبعة التي أغلقت:
- على ارتفاع؛
- دون تغيير؛
- على انخفاض.
والغرض منه هو اختبار ما إذا كانت حركة المؤشر الرئيسي تمثيلية.
قد تكون جلسة TEDPIX الإيجابية ذات نطاق السوق الضعيف مدفوعة بمجموعة ضيقة من الشركات الكبرى. وقد تشير مكاسب المؤشر المتواضعة مع نطاق سوق قوي إلى مشاركة أصح عبر السوق الأوسع.
لذلك، يعد نطاق السوق اختباراً لجودة تحرك السوق، وليس لمجرد اتجاهه.
لوحة المؤشر
تقارن لوحة المؤشرات بين ثلاثة منظورات لسوق الأسهم المدرجة في إيران.
TEDPIX مُرجَّح بالقيمة السوقية وبالتالي يعكس تأثير الشركات الكبرى.
المؤشر متساوي الأوزان (Equal-Weight) يعطي رؤية أوضح لأداء السهم المدرج النموذجي.
IFX يتتبع بورصة فرابورس الإيرانية (Iran Fara Bourse) ويضيف جزءاً آخر من السوق المدرجة إلى المقارنة.
عندما يتفوق TEDPIX بشكل كبير على المؤشر متساوي الأوزان، فقد تكون قوة السوق مركزة في الشركات الكبرى.
وعندما يكون أداء المؤشر متساوي الأوزان أفضل، قد تكون المشاركة أوسع أو أقوى بين الأسهم الأصغر.
توضح مقارنة مؤشر IFX بمؤشرات بورصة طهران للأوراق المالية ما إذا كانت الحركة تمتد إلى ما بعد البورصة الرئيسية.
طوابير الإغلاق
تخضع الأسهم الإيرانية المدرجة للحدود اليومية لتغير الأسعار.
في نهاية الجلسة، قد تظل الأوامر غير المنفذة عند الحد الأعلى أو الأدنى المسموح به للأسعار. يقسم Hormuz هذه الأوامر إلى طوابير شراء وطوابير بيع.
قد يشير طابور الشراء الكبير إلى وجود طلب لم يكن بالإمكان تنفيذه ضمن النطاق المسموح به.
قد يشير طابور البيع الكبير إلى محاولة المستثمرين الخروج دون وجود عدد كافٍ من المشترين.
تفيد طوابير الإغلاق لأنها تكشف عن الخلل قصير الأجل والسيولة المحتجزة. كما تبين سبب عدم كون سعر الإغلاق سعراً يسهل تنفيذه لأمر كبير.
يمكن أن يختفي الطابور قبل الجلسة التالية. وهو ليس طلباً أو عرضاً مستقبلياً مضموناً.
التقييم الإجمالي
تعرض لوحة القيادة مقاييس التقييم والربحية على مستوى السوق، بما في ذلك:
- نسبة السعر إلى الربحية (P/E)؛
- نسبة السعر إلى المبيعات (P/S)؛
- نسبة السعر إلى القيمة الدفترية (P/B)؛
- نسبة قيمة المنشأة إلى الأرباح قبل الفوائد والضرائب (EV/EBIT)؛
- عائد التوزيعات؛
- العائد على الأصول (ROA)؛
- العائد على حقوق الملكية (ROE)؛
- نسبة توزيع الأرباح.
يجيب كل مقياس عن سؤال مختلف.
P/E يقارن السعر بالأرباح المعلنة.
P/S يقارن التقييم بالإيرادات ويمكن أن يكون مفيداً عندما تكون الأرباح متقلبة.
P/B يقارن سعر السوق بحقوق الملكية المعلنة وهو مهم بشكل خاص للبنوك والشركات ذات الأصول الضخمة.
EV/EBIT يشمل كلاً من الديون وحقوق الملكية، مما يوفر تقييماً تشغيلياً أوسع.
مؤشرا العائد على الأصول (ROA) والعائد على حقوق الملكية (ROE) يساعدان في تقييم مدى فعالية الشركات في استخدام الأصول ورأس مال المساهمين.
عائد التوزيعات ونسبة توزيع الأرباح يظهران مقدار الأرباح المعلنة التي تصل إلى المساهمين.
يجب قراءة هذه النسب بحذر. إذ يمكن للتضخم، والأسعار المنظمة، وتكوين القطاعات، وأسعار الصرف المحاسبية أن تشوه المقارنات المحلية والدولية على حد سواء.
قد يشير مضاعف التقييم المنخفض إلى وجود قيمة. ولكنه قد يعكس أيضاً ضعف جودة الأرباح، أو محدودية السيولة، أو مخاطر هيكلية.
تدوير رؤوس الأموال
يقارن تدوير رؤوس الأموال (Capital Rotation) بين:
- الأسهم المدرجة؛
- صناديق المؤشرات المتداولة ذات الدخل الثابت؛
- صناديق المؤشرات المتداولة للذهب.
يتم تقييم كل فئة من خلال عائد الجلسة وقيمة التداول وصافي تدفقات الأفراد.
ويساعد ذلك في الكشف عن الوجهة التي يسعى رأس المال المحلي للتعرض لها.
قد يشير التحرك نحو الأسهم إلى شهية أكبر للمخاطرة.
وقد يعكس التحرك نحو الدخل الثابت تفضيل العائد أو السيولة أو الاستقرار.
وقد يمثل التحرك نحو الذهب إشارة إلى التحوط ضد التضخم أو تقلبات العملة.
لا يكفي العائد وحده لتحديد تدوير رأس المال. وتظهر قيمة التداول وتدفقات المستثمرين ما إذا كانت حركة الأسعار مدعومة بمشاركة ذات مغزى.
نبض القطاعات
يصنف نبض القطاعات (Sector Pulse) الصناعات حسب:
- العائد اليومي؛
- صافي تدفقات الأفراد.
تحدد رؤية العائد القطاعات القائدة للأسعار.
وتظهر رؤية التدفقات المكان الذي كان فيه المستثمرون الأفراد المحليون المشترين أو البائعين الصافين.
ويمكن للفارق بين الاثنين أن يكون كاشفًا.
قد يرتفع قطاع ما بينما يبيع المستثمرون الأفراد. وقد ينخفض قطاع آخر بينما يجتذب صافي شراء. وتساعد هذه التباينات في التمييز بين الزخم وإعادة التموضع.
كما يوفر نبض القطاعات (Sector Pulse) جسرًا طبيعيًا من مساحة عمل الأسواق إلى نبض الصناعة (Industry Pulse) وخريطة الصناعة (Industry Map) في هرمز.
تسلسل قراءة عملي
يكون التقرير اليومي لسوق طهران (Tehran Market Daily) أكثر فائدة عند قراءته بالترتيب:
- ابدأ بمؤشر TEDPIX وقراءة الجلسة.
- قارن بين TEDPIX والمؤشر المرجح بالأوزان المتساوية (Equal-Weight) ومؤشر IFX.
- تحقق من اتساع السوق.
- راجع القيمة السوقية للشركات المدرجة وقيمة التداول اليومية.
- افحص صافي تدفقات الأفراد.
- تفقد طوابير الطلب والعرض عند الإغلاق.
- قارن الأسهم بالدخل الثابت والذهب.
- راجع نبض القطاعات (Sector Pulse).
- افتح الصناعة ذات الصلة للحصول على سياق أعمق.
- عد إلى موجه السوق (Market Navigator) واسأل عما تعنيه الإشارة بالنسبة للقرار الفعلي.
يمنع هذا التسلسل رقمًا واحدًا من أن يصبح القصة بأكملها.
لماذا تكتسب طبقات اللغة الإنجليزية والدولار الأمريكي أهمية
تظل المعلومات باللغة الإنجليزية حول السوق المدرجة في إيران مجزأة. قد توفر الخدمات المتاحة على نطاق واسع مؤشر طهران الرئيسي أو سلسلة القيمة السوقية الشهرية بالدولار الأمريكي (USD)، ولكن هذه المعلومات عادة ما تكون منفصلة عن اتساع السوق، وطوابير الطلبات، والتقييم، وتدفقات المستثمرين المحليين، وتدوير رأس المال، وسياق القرار المرتبط بها.
إن بيان التموضع الدقيق لهرمز هو:
حسب علمنا، هرمز هي أول منصة عامة باللغة الإنجليزية تجمع بين بيانات السوق المدرجة الإيرانية الحالية، وتقييمات الدولار الأمريكي (USD) المتزامنة، واتساع السوق، والسيولة، وعدم توازن الطلبات، والتقييم الإجمالي، وتدوير رأس المال المحلي، وذكاء القرارات المرتبطة في مساحة عمل واحدة.
يتعلق هذا الادعاء بالجمع بين هذه الطبقات، وليس بوجود كل نقطة بيانات بمفردها.
من الإشارة إلى التقييم
ليس الغرض من مساحة عمل أسواق هرمز (Hormuz Markets) التنبؤ بالحركة القادمة للسوق.
بل إن غرضها هو تحسين التقدير واتخاذ القرار.
يظهر التقرير اليومي لسوق طهران (Tehran Market Daily) ما حدث خلف العناوين الرئيسية: ما إذا كانت المشاركة واسعة النطاق، وما إذا كانت السيولة كافية، وأين تحرك رأس المال المحلي، وأي القطاعات كانت قائدة.
يطرح موجه السوق (Market Navigator) السؤال الأكثر صعوبة:
ماذا يعني هذا السوق بالنسبة للقرار الذي تحاول اتخاذه بالفعل؟
هذا التمييز هو القيمة المركزية لمساحة العمل.
يمكن لإشارة السوق أن تجذب الانتباه. أما الإشارة التي توضع داخل السياق المالي والتجاري والتشغيلي الصحيح فيمكنها دعم اتخاذ القرار.