How to Read Iran’s Markets with Hormuz
A practical guide to current market signals, USD valuations and decision-oriented intelligence
Iran’s market is not difficult to understand because information is entirely absent. The deeper problem is that the available information is rarely organised around the questions that matter.
A rising index does not tell us whether the move was widely shared. A large market valuation says little about how easily that value can be traded. Nominal gains in rials may disappear when translated into dollars. Strong domestic demand may exist while payment, regulation or market access makes the opportunity difficult to execute.
The Hormuz Markets workspace addresses these different problems through two complementary views:
Market Navigator helps users examine a market through a specific objective and time horizon.
Tehran Market Daily provides a current post-close reading of Iran’s listed equity market.
One begins with the decision. The other begins with the latest market evidence. Used together, they help move from a headline signal toward a more defensible interpretation.
Which view should you use?
Use Market Navigator when your question is strategic:
- Is this market relevant to an investment thesis?
- What is the most practical route to enter it?
- Can we sell into it or source from it?
- Which risks should be monitored before acting?
Use Tehran Market Daily when your question concerns current market behaviour:
- Was the latest market move broad or narrow?
- How much liquidity was available?
- Were domestic individual investors buying or selling?
- Was capital moving toward equities, fixed income or gold?
- Which sectors led the session?
- What is the listed market worth in current USD terms?
The distinction is important. A strong trading session does not prove that a market is accessible or investable. A difficult session does not necessarily invalidate a sound long-term opportunity.
Market Navigator: begin with the decision
Market Navigator builds its analysis around three selections:
- the market;
- the objective;
- the time horizon.
This structure allows the same market to be interpreted differently depending on what the user intends to do.
Choose the market
Hormuz organises the Iranian economy through market lenses such as:
- foreign exchange;
- capital markets;
- banking and credit;
- real assets;
- consumer demand;
- enterprise demand;
- trade and transit;
- public projects.
This is more than a category selection. It defines the economic environment surrounding the decision.
A company selecting Enterprise Demand may need to study industrial buyers, procurement cycles, replacement needs and buyer concentration.
A user selecting Foreign Exchange is asking a different set of questions: exposure to currency movements, settlement routes, imported-input costs and the conversion of rial returns into economic value.
The correct market lens determines which signals matter and which risks deserve priority.
Define the objective
The same market can look attractive for one purpose and unsuitable for another. Market Navigator therefore separates several objectives.
Invest
The investment view focuses on valuation, risk-adjusted economics, liquidity, evidence and execution.
It asks whether apparent returns remain meaningful after inflation and currency effects, whether the exposure can be entered and exited, and what evidence supports the thesis.
Enter the market
This view focuses on practical access.
It directs attention toward licensing, partnerships, settlement, infrastructure and the lowest-risk route through which the opportunity can actually be reached.
Sell
The Sell view concentrates on reachable demand rather than theoretical market size.
It considers buyers, procurement channels, distribution, payment timing, service requirements and the effect of currency conditions on margins.
Source
The Source view is designed for supplier and capacity research.
It gives greater weight to continuity, quality, logistics, seasonality, concentration risk and counterparty reliability.
Preserve capital
This objective asks whether an exposure can retain economic value after inflation, depreciation, liquidity constraints and exit costs.
A nominal increase in rials may still represent a loss in USD or real purchasing power.
Monitor risk
This view identifies developments that could change pricing, access, demand or execution.
It turns a broad concern into a practical monitoring framework.
Select the time horizon
Hormuz separates three periods:
- current conditions;
- six to twelve months;
- two to three years.
The current view places more weight on immediate liquidity, settlement, demand and operational friction.
The medium-term view is more sensitive to repricing, policy effects and demand resilience.
The longer horizon gives greater importance to infrastructure, productive capacity, regulation and durable competitive positioning.
This prevents a temporary disruption from being mistaken for structural weakness. It also prevents an attractive long-term thesis from being used to overlook immediate execution problems.
How to interpret the Navigator output
The result is not a score and not a recommendation. It is a structured interpretation of the selected decision.
The first section presents a concise market thesis, a dominant signal, a secondary signal and an appropriate posture.
A market may appear attractive but execution-sensitive, visible but illiquid, fragmented but opportunity-rich, or relevant only under selective conditions.
Hormuz then evaluates factors such as:
- currency exposure;
- capital intensity;
- liquidity;
- regulatory friction;
- data visibility;
- time to revenue.
These factors help reveal the bottleneck.
A market can show strong demand while remaining difficult to verify. Another may offer visible prices but limited liquidity. A capital-light opportunity may still face long payment cycles or regulatory barriers.
The purpose is not to compress the market into one number. It is to show where the decision may fail.
Signals, priorities and evidence
The Navigator identifies conditions that deserve attention and then translates them into practical research priorities.
In Enterprise Demand, for example, the relevant signals may include import substitution, maintenance pressure and buyer concentration.
Import substitution may create demand, but only where quality, service and pricing remain viable.
Maintenance pressure may reveal recurring demand tied to an installed industrial base rather than new projects alone.
Buyer concentration may simplify market access while increasing bargaining power and counterparty risk.
The next section turns these observations into a practical sequence:
- test the economics;
- inspect execution;
- find evidence.
This is the main value of the Navigator. It does not merely describe a market. It helps define what must be verified before the decision becomes credible.
Connected intelligence
Market Navigator links the selected view to the wider Hormuz intelligence graph.
Depending on the market and objective, this may include:
- related market segments;
- Market Cases;
- comparisons;
- articles;
- opportunities;
- industries;
- provinces;
- recurring challenges.
This allows the user to move from a broad market statement into specific operating situations.
Instead of relying on a claim such as “enterprise demand is strong,” the user can inspect relevant companies, cases, locations and constraints.
The market is therefore presented not as an isolated category, but as a network of commercial evidence.
Tehran Market Daily: reading the latest session
Tehran Market Daily is the current-data side of the Markets workspace.
It combines:
- price;
- market breadth;
- liquidity;
- closing order imbalance;
- valuation;
- investor flow;
- capital rotation;
- sector leadership.
The page presents the data in English and converts current rial values through one shared Hormuz Market Data Hub rate.
It should be read as a synchronized post-close market signal. It does not confirm that a foreign investor can access, custody or repatriate a specific security.
Headline direction and session quality
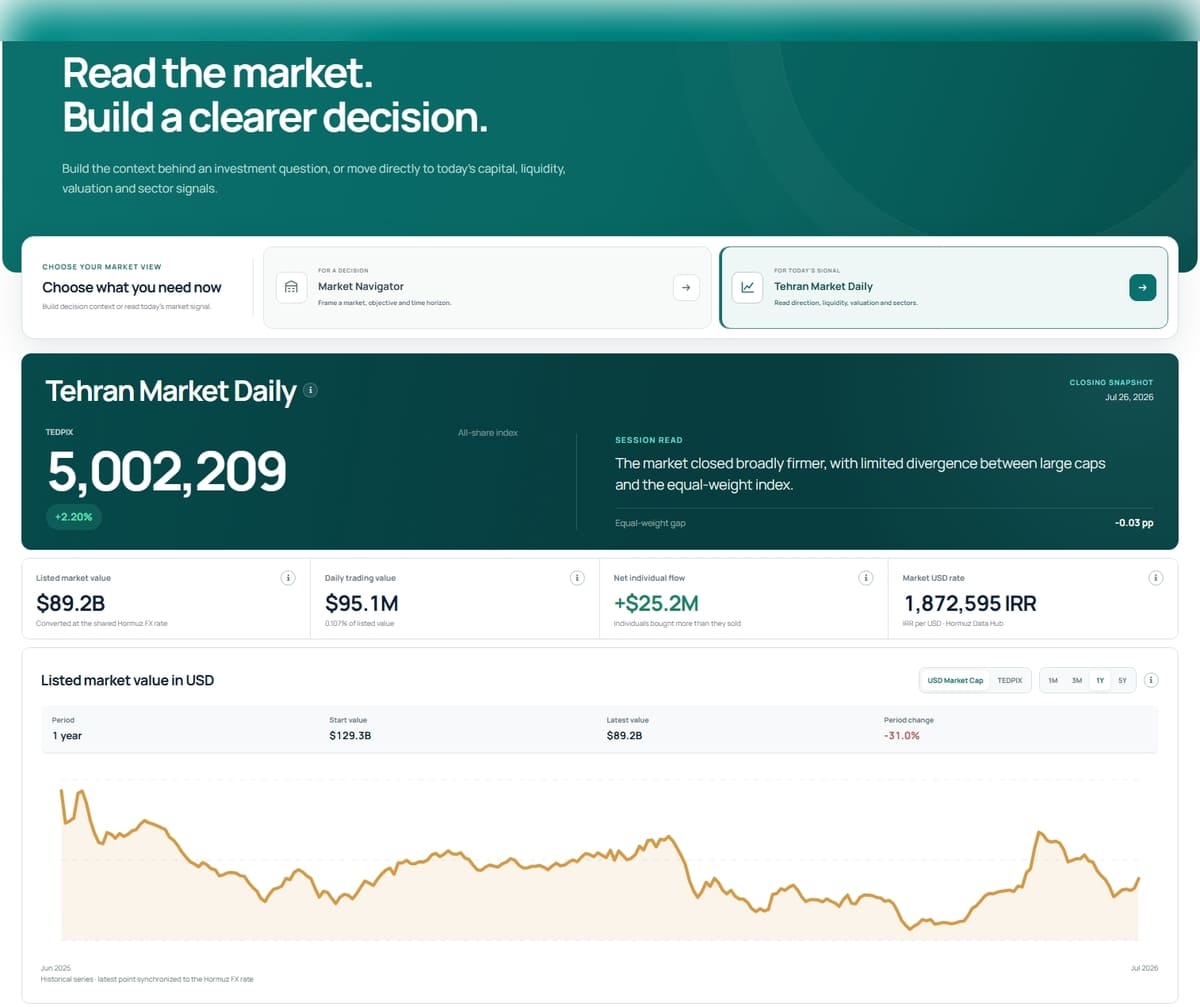
The dashboard begins with TEDPIX, the main capitalization-weighted index of the Tehran Stock Exchange.
The percentage change shows the direction of the latest session, but TEDPIX alone can be misleading because larger companies have more influence over the index.
Hormuz therefore adds a Session Read, comparing the headline move with broader measures such as the Equal-Weight index.
This answers a more useful question:
Was the market move widely shared, or driven mainly by the largest companies?
A rising index supported by positive breadth and stronger Equal-Weight performance suggests broader participation. A rising TEDPIX alongside weak breadth may indicate that only a narrow group of large companies carried the market.
Listed market value
Listed market value is the combined value of covered listed shares, converted from rials into USD using the current shared Hormuz rate.
It provides a readable estimate of the observable scale of Iran’s listed equity market.
The figure is useful for:
- comparing current market value with earlier periods;
- distinguishing nominal rial growth from USD performance;
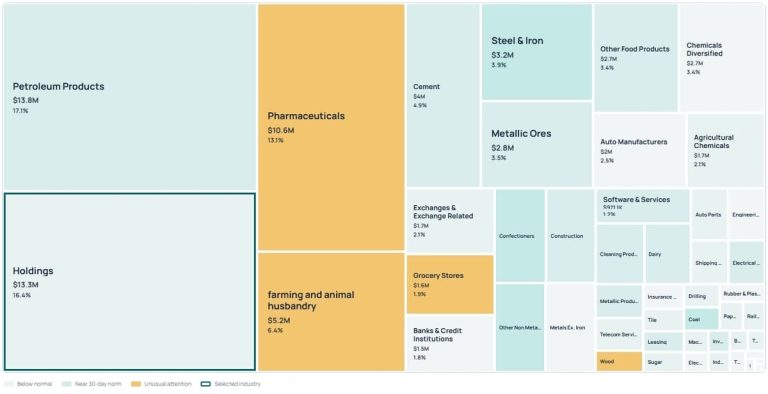
- comparing the scale of listed industries;
- placing daily trading value in context;
- making broad international comparisons.
It is not equivalent to free-float capitalisation, foreign-investable capitalisation or executable market depth.
A market can appear large while remaining difficult to transact at scale.
Market USD rate
Every current rial-to-dollar conversion on the page uses the same Market Data Hub reference.
This keeps the headline figures, historical chart and sector values internally consistent.
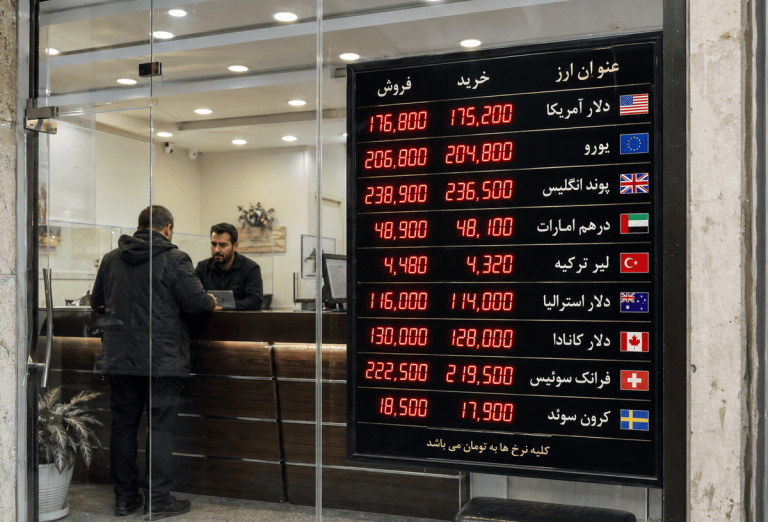
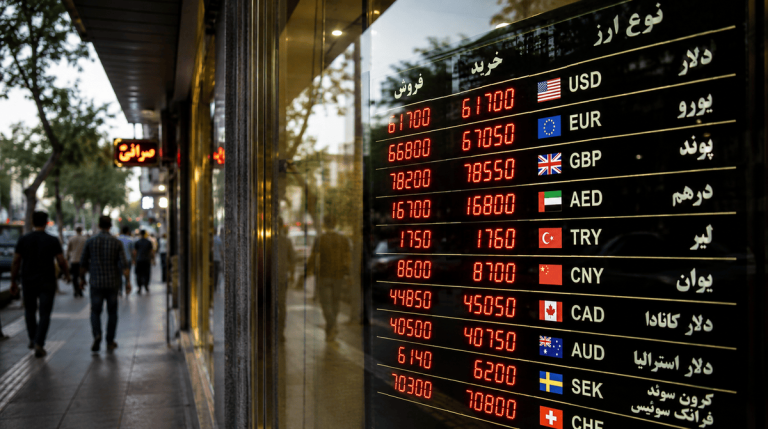
The USD layer is important because inflation and currency depreciation can make nominal rial figures difficult to interpret. A local index may rise while the market loses value in dollar terms.
The rate is a shared analytical reference. It is not a guarantee that every market participant can settle funds at precisely that level.
Daily trading value
Daily trading value shows the value of listed shares exchanged during the session.
Its main use is to assess liquidity and participation.
A market with a large capitalisation but low turnover may have limited practical depth. A smaller market with stronger turnover may offer more active price discovery.
The relationship between trading value and market value is therefore often more informative than either number on its own.
Daily trading value does not represent new investment in factories or productive assets. It measures transactions between buyers and sellers in the secondary market.
Net individual flow
Net individual flow measures purchases by Iranian individual-investor accounts after subtracting their sales.
It is a domestic sentiment and positioning signal.
A positive figure means individual accounts were net buyers. A negative figure may indicate caution, profit-taking or movement toward other asset classes.
The signal becomes more useful when read alongside index performance, trading value and capital rotation.
For example, a rising market with negative individual flow may suggest that the strength was concentrated in large companies or supported by other investor groups.
It is not a measure of foreign portfolio flow.
Market history: local index versus USD value
The historical section allows users to switch between TEDPIX and USD Market Cap across different time horizons.
TEDPIX answers:
How did listed equities perform inside the local market?
USD Market Cap answers:
What happened to the translated foreign-currency value of the listed market?
The difference can be substantial.
A market may reach a new nominal index high while remaining below an earlier USD valuation. For international investors, and for domestic investors concerned with real purchasing power, the dollar view often provides the more meaningful long-term comparison.
The latest USD point is calculated from the same current listed-market value and Market Data Hub rate used in the headline section, keeping the current figures aligned.
Market breadth
Market breadth shows the number and share of tracked symbols that closed:
- higher;
- unchanged;
- lower.
Its purpose is to test whether the headline index movement was representative.
A positive TEDPIX session with weak breadth may have been driven by a narrow group of large companies. A modest index gain with strong breadth may indicate healthier participation across the wider market.
Breadth is therefore a test of the quality of the market move, not merely its direction.
Index Board
The Index Board compares three views of Iran’s listed market.
TEDPIX is capitalization-weighted and therefore reflects the influence of the largest companies.
Equal-Weight gives a clearer view of how the typical listed share performed.
IFX tracks Iran Fara Bourse and adds another part of the listed market to the comparison.
When TEDPIX substantially outperforms Equal-Weight, market strength may be concentrated in large companies.
When Equal-Weight performs better, participation may be broader or stronger among smaller shares.
Comparing IFX with the Tehran Stock Exchange indices shows whether the movement extends beyond the main exchange.
Closing queues
Iranian listed equities operate under daily price limits.
At the end of a session, unexecuted orders may remain at the upper or lower permitted price. Hormuz separates these into buy and sell queues.
A large buy queue may indicate demand that could not be executed within the permitted range.
A large sell queue may indicate investors trying to exit without enough buyers.
Closing queues are useful because they reveal short-term imbalance and trapped liquidity. They also show why the closing price may not be an easily executable price for a large order.
A queue can disappear before the next session. It is not guaranteed future demand or supply.
Aggregate valuation
The dashboard presents market-wide valuation and profitability measures, including:
- P/E;
- P/S;
- P/B;
- EV/EBIT;
- dividend yield;
- ROA;
- ROE;
- payout ratio.
Each measure answers a different question.
P/E compares price with reported earnings.
P/S compares valuation with revenue and can be useful where profits are volatile.
P/B compares market price with reported equity and is especially relevant for banks and asset-heavy companies.
EV/EBIT includes both debt and equity, providing a broader operating valuation.
ROA and ROE help assess how effectively companies use assets and shareholder capital.
Dividend yield and payout ratio show how much reported profit reaches shareholders.
These ratios should be read with care. Inflation, regulated prices, sector composition and accounting exchange rates can distort both domestic and international comparisons.
A low valuation multiple may indicate value. It may also reflect weak earnings quality, limited liquidity or structural risk.
Capital Rotation
Capital Rotation compares:
- listed equities;
- fixed-income ETFs;
- gold ETFs.
Each category is evaluated through session return, trading value and net individual flow.
This helps reveal where domestic capital is seeking exposure.
Movement toward equities may indicate greater risk appetite.
Movement toward fixed income may reflect preference for yield, liquidity or stability.
Movement toward gold may signal inflation or currency hedging.
Return alone is not enough to establish capital rotation. Trading value and investor flow show whether the price movement was supported by meaningful participation.
Sector Pulse
Sector Pulse ranks industries by:
- daily return;
- net individual flow.
The return view identifies price leadership.
The flow view shows where domestic individual investors were net buyers or sellers.
The difference between the two can be revealing.
A sector may rise while individual investors sell. Another may fall while attracting net buying. These divergences help distinguish momentum from positioning.
Sector Pulse also provides the natural bridge from the Markets workspace into Hormuz’s Industry Pulse and Industry Map.
A practical reading sequence
Tehran Market Daily is most useful when read in order:
- Begin with TEDPIX and the Session Read.
- Compare TEDPIX with Equal-Weight and IFX.
- Check market breadth.
- Review listed market value and daily trading value.
- Examine net individual flow.
- Inspect closing queues.
- Compare equities with fixed income and gold.
- Review Sector Pulse.
- Open the relevant industry for deeper context.
- Return to Market Navigator and ask what the signal means for the actual decision.
This sequence prevents one number from becoming the whole story.
Why the English and USD layers matter
English-language information on Iran’s listed market remains fragmented. Widely discoverable services may provide the headline Tehran index or a monthly market-capitalisation series in USD, but these are usually separate from breadth, order queues, valuation, domestic investor flows, capital rotation and connected decision context.
A careful positioning statement for Hormuz is:
To our knowledge, Hormuz is the first public English-language platform to combine current Iranian listed-market data, synchronized USD valuations, breadth, liquidity, order imbalance, aggregate valuation, domestic capital rotation and connected decision intelligence in one workspace.
The claim concerns the combination of these layers, not the existence of each data point individually.
From signal to judgment
The purpose of the Hormuz Markets workspace is not to predict the next market move.
Its purpose is to improve judgment.
Tehran Market Daily shows what happened beneath the headline: whether participation was broad, whether liquidity was sufficient, where domestic capital moved and which sectors led.
Market Navigator asks the more difficult question:
What does this market mean for the decision you are actually trying to make?
That distinction is the central value of the workspace.
A market signal can attract attention. A signal placed inside the right financial, commercial and operational context can support a decision.