How to Explore Iran’s Geography with Hormuz Map
A map can show where a province is. It cannot, by itself, explain what that province means.
Iran’s provinces differ not only in size, population and physical geography, but also in settlement patterns, production systems, water pressure, infrastructure and access to the rest of the country. A province may contain a major industrial base but face serious environmental constraints. Another may have a smaller population yet occupy a critical position along a trade or transport corridor.
Understanding these differences usually requires moving between maps, statistical tables, company directories, climate sources and transport services. Hormuz Map brings these perspectives into one interactive environment.
The platform is designed as a starting point for understanding Iran at the provincial level. It connects territorial and demographic data with Hormuz intelligence entries, water and climate indicators, province comparison and corridor-planning tools.
This guide explains how to use each part of the map and how to interpret the information it provides.
Begin with the province, not the individual data point
A province is more than an administrative boundary. It is a geographic system shaped by cities, population concentration, industries, resources, infrastructure and connections to neighbouring regions.
When using Hormuz Map, the most useful approach is to begin with the province as a whole before examining individual companies, projects or transport routes.
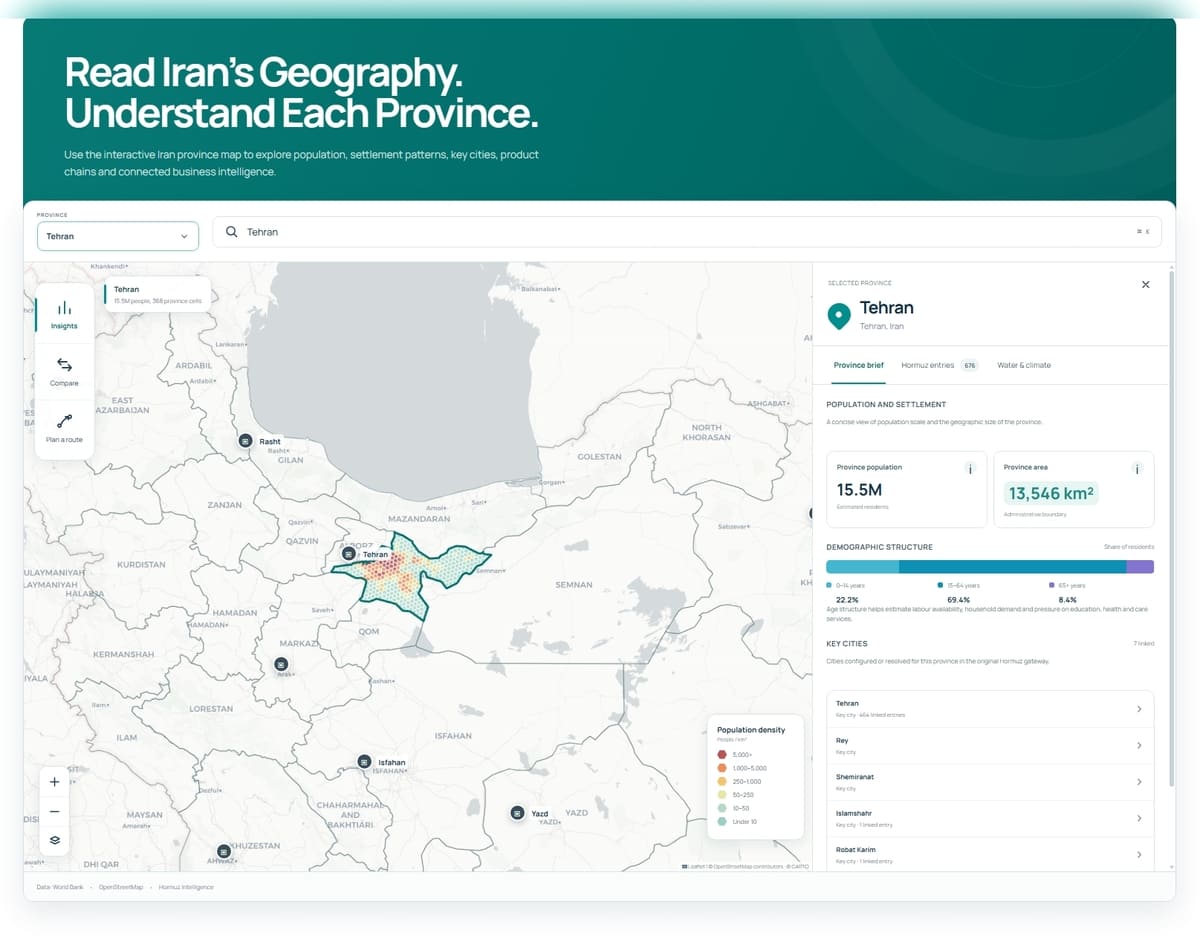
Select a province from the dropdown menu, search for it by name or choose it directly on the map. The map will focus on the selected area and open its provincial profile.
The first view is the Province Brief. This section provides the basic context required to interpret everything that follows.
Depending on the available data, it may include:
- total population
- provincial area
- population and settlement indicators
- demographic structure
- key cities
These figures should not be read in isolation.
A large provincial population does not necessarily indicate a broad consumer market if most residents are concentrated in one metropolitan area. A geographically large province may have relatively few major settlements, creating long distances between production centres, infrastructure and end markets.
The key-cities section helps make this structure visible. It shows where population and economic activity are likely to be concentrated and which urban centres shape the province’s internal geography.
How to read the population cells
The coloured shapes visible inside a selected province are not conventional image pixels. They are hexagonal geographic cells used to show how population is distributed across the province.
Hormuz Map uses H3 level-6 cells, each covering approximately 36 square kilometres. Every cell contains two modelled values:
- the estimated number of people living inside the cell;
- the estimated population density, measured as people per square kilometre.
Colour represents density rather than total provincial population. Lighter cells indicate more sparsely populated areas, while warmer colours indicate progressively higher concentrations of people.
The current density ranges are:
- 10–50 people per km²: low population concentration
- 50–250 people per km²: moderate concentration
- 250–1,000 people per km²: relatively dense settlement
- 1,000–5,000 people per km²: high concentration
- 5,000+ people per km²: very high concentration
Selecting or hovering over a cell reveals its estimated population and density.
These cells are useful for understanding settlement patterns that provincial averages can hide. Two provinces may have similar overall density figures, while one has population spread across several cities and the other is concentrated in a small metropolitan area.
The cells should not be interpreted as exact residential boundaries or as a count of individually located people. They are modelled geospatial estimates aggregated into a consistent grid. Their purpose is to show broad patterns of population concentration and spatial distribution, not to replace official census data or local demographic research.
Move from provincial context to connected intelligence
Once the basic territorial and demographic picture is clear, open the Hormuz Entries tab.
This section connects the province to the wider Hormuz intelligence system. Instead of treating the province as a static geographic unit, it shows the productive, commercial and institutional activities associated with it.
The entries are organised into several categories.
Product chains
Product chains appear first because they provide one of the most useful ways to understand a regional economy.
A product chain describes the connected stages through which a material, product or service moves. These stages may include extraction, production, processing, logistics, distribution, domestic consumption and export.
For example, the presence of a steel producer provides only a partial view of a province. A fuller analysis may also consider:
- access to iron ore and other raw materials
- energy and water requirements
- industrial processing capacity
- railway or road connections
- downstream manufacturing
- access to domestic customers or export terminals
Viewing the related product chains helps place individual companies and infrastructure assets inside a larger economic system.
It also makes it easier to identify where a province participates in a chain. Some provinces are primarily production centres. Others function as processing, consumption, logistics or export nodes. Many play several roles at once.
Industries and markets
The industries section identifies the main sectors connected to the province through Hormuz entries.
This can help distinguish between a province with a diversified industrial base and one that depends heavily on a limited number of activities. It can also reveal connections that are not immediately visible from general provincial statistics.
The markets section adds another perspective. It may connect the province to areas such as industrial property, public projects, trade, special economic zones, consumer demand or capital-market activity.
Industries describe what happens in the province. Markets help explain the commercial environments in which those activities operate.
Opportunities
Opportunities represent specific areas where commercial, investment or operational activity may be possible.
They should not be interpreted as automatic recommendations. An opportunity may still require verification of ownership, licensing, financing, demand, infrastructure, sanctions exposure or counterparty reliability.
Their purpose on the map is to show where further investigation may be justified.
A useful sequence is:
- understand the province;
- identify its product chains and industries;
- examine connected opportunities;
- verify the operational conditions independently.
This is generally more reliable than starting with an isolated opportunity and attempting to understand its regional context afterwards.
Infrastructure
Infrastructure determines whether economic potential can be converted into practical activity.
Hormuz infrastructure entries may include airports, ports, railway nodes, industrial zones, border crossings, logistics centres and other strategic assets.
The significance of infrastructure depends on what it connects.
A railway junction is more important when viewed in relation to mines, industrial clusters, cities and export routes. A port becomes more meaningful when connected to the product chains and inland markets it serves.
The map therefore treats infrastructure as part of a regional system rather than as a list of standalone facilities.
Companies
Company profiles show organisations associated with the selected province.
These may include major producers, industrial groups, financial institutions, logistics companies, technology businesses or other relevant entities.
Company presence can indicate the economic weight of a province, but it should be interpreted carefully. A company’s registered location, headquarters, production site and main market may be in different places.
The purpose of this section is to support discovery and further research, not to replace company-level due diligence.
Examine water and climate conditions
Economic geography cannot be separated from environmental conditions.
Water availability, temperature patterns and precipitation can influence agriculture, industrial operations, energy demand, urban growth and infrastructure planning. Their effects may accumulate gradually rather than appearing as a single visible disruption.
The Water & Climate tab provides a provincial reference view of these pressures.
Monthly temperature and precipitation charts compare a historical baseline with a more recent period. The charts can also be opened in a larger modal view, where the monthly values and changes are easier to examine.
The patterns are often more informative than the annual average alone.
Two provinces may have similar annual precipitation totals but receive that rainfall at different times of the year. A change concentrated in winter months may have different implications from a decline spread across the full year.
Temperature patterns can also indicate whether recent conditions are consistently warmer or whether the change is concentrated in particular seasons.
The section also include a composite pressure indicator and links to related Hormuz challenges, such as water scarcity or environmental stress.
These indicators should be treated as signals for further investigation. They do not replace local hydrological studies, site-level measurements or operational assessments. Their value lies in helping the user identify which questions need to be asked.
Compare two provinces in the same frame
Provincial data becomes more useful when it can be compared.
The Compare tool allows two provinces to be viewed together. This helps reveal differences that may remain unclear when each province is examined separately.
Comparison can be useful for questions such as:
- Which province has a larger or more concentrated population?
- Which has stronger connections to a particular product chain?
- Where is the relevant infrastructure more developed?
- Which province appears more exposed to water or climate pressure?
- Which location has better access to major cities, airports or transport corridors?
The strongest comparison is not necessarily between neighbouring provinces. It may be between two regions competing for the same industry, serving similar markets or performing different roles in the same product chain.
For example, one province may offer stronger production capacity while another offers better access to ports and export markets. The appropriate choice depends on the commercial objective.
The comparison tool does not produce a final investment ranking. It creates a structured basis for asking better questions.
Explore corridors between locations
Provincial analysis explains what exists in a place. Corridor analysis explains how places connect.
The Plan a Route tool allows the user to select an origin and destination and review several forms of transport access.
The road-route view provides:
- estimated driving distance
- estimated travel time
- the calculated road path
- the nearest registered airport to each endpoint
The road route is a modelled result. It may not always represent the route most commonly used by commercial drivers, and it does not account for every operational factor, such as temporary restrictions, vehicle type or current road conditions.
Its purpose is to provide an initial measure of geographic connection.
Direct and connecting rail corridors
Rail access is often more difficult to interpret.
A city may have a railway station without a direct service to the selected destination. A practical journey may still be possible through a major interchange.
Hormuz Map therefore checks for two forms of rail connection:
- a registered direct corridor;
- a registered connection using one interchange.
When a direct corridor is available, the map displays its principal stations and indicative route.
When no direct connection is registered, the system can examine whether the origin and destination are connected through a shared rail hub. It then proposes an efficient one-change route based on the available corridor registry and the importance of the interchange.
For example, a route between Isfahan and Kerman may be presented through Yazd when no direct observed corridor is available in the system. Other journeys may use major hubs such as Tehran, Qom or Bafq.
This feature is intended to reveal network possibilities that may not appear in a conventional direct-route search.
It does not confirm:
- ticket availability
- current operating days
- connection times
- passenger capacity
- freight acceptance
- uninterrupted service on the selected date
A suggested rail connection should therefore be treated as a network-planning insight, followed by verification through an appropriate booking or operating source.
Use each layer for the question it can answer
Hormuz Map brings several forms of information together, but each layer has a different purpose.
The Province Brief establishes territorial and demographic context.
Hormuz Entries reveal the province’s productive and commercial connections.
Water & Climate indicators identify environmental patterns and possible pressure points.
Comparison helps distinguish between locations.
Corridor planning shows how cities and provinces connect through road, air and rail access.
No single layer provides a complete answer. Their value comes from being used together.
A province with strong industrial activity may face water constraints. A region with significant resources may lack efficient access to markets. A smaller province may occupy a critical position in a national corridor. A company may appear attractive until its dependence on distant infrastructure becomes visible.
The map is designed to make these relationships easier to see.
A starting point for better geographic decisions
Hormuz Map is not a booking platform, a feasibility study or a substitute for local verification.
It is an orientation and intelligence tool.
It can help users:
- understand the basic structure of an Iranian province;
- identify major cities and settlement patterns;
- explore product chains, industries and markets;
- discover connected companies, infrastructure and opportunities;
- review water and climate signals;
- compare provinces using a common framework;
- examine road, airport and rail connections between locations.
Its purpose is not to reduce a province to a score. It is to show the relationships that shape its economic position.
Good geographic decisions rarely come from a single number. They come from understanding how population, production, infrastructure, environment and access interact.
Hormuz Map provides a place to begin that analysis.