How to Read the Strait of Hormuz Radar
A practical guide to interpreting energy prices, shipping conditions, maritime risk and market signals around the Strait of Hormuz.
The Strait of Hormuz is not just a shipping route. It is where physical energy flows, crude pricing, tanker availability, freight, insurance and maritime risk interact. No single number describes that system well.
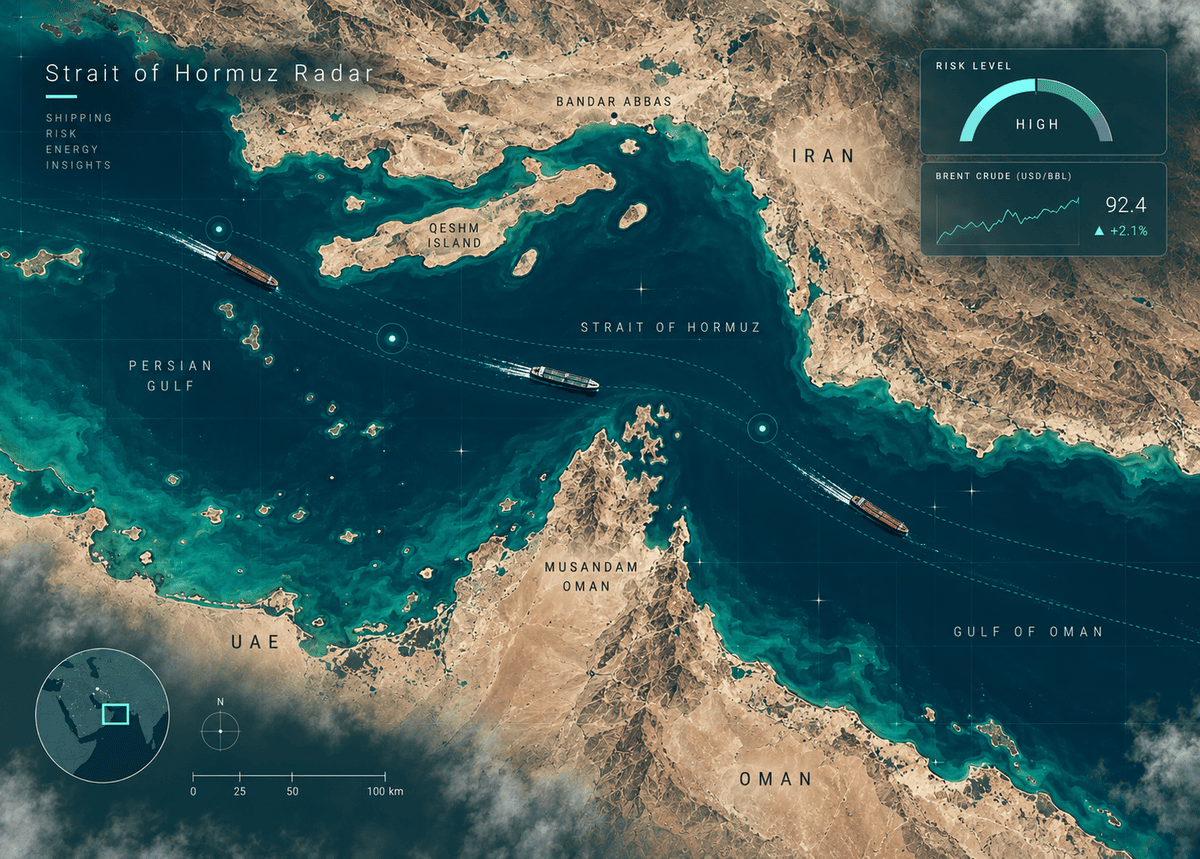
The Hormuz Strait & Energy Radar brings those signals into one decision view. This guide explains how to read the current version of the Radar, what its indicators mean, and which comparisons are most useful.
Start with the four headline cards
The top row is designed for orientation rather than full analysis. It shows the current Iran Heavy reference, GME Oman, the Brent market view, and either Hormuz Flow Stress or Strait Risk depending on the quality of available flow evidence.
Iran Heavy
Iran Heavy represents the current public price environment for Iranian heavy crude. The Radar uses a public daily reference where available, cross-checks it against an independent source, and can show a model estimate separately.
It should be treated as a market reference rather than a confirmed transaction price for a particular cargo. Actual cargo pricing can differ with destination, quality, freight, delivery terms, contractual arrangements and market access.
GME Oman
GME Oman is a useful regional crude reference for Gulf export markets. Comparing it with Iran Heavy and Brent helps separate changes specific to Iranian crude from broader regional or global repricing.
Brent Market
The Brent headline is now presented as a market view rather than treating one series as if it were a live spot quote.
When a current Brent futures observation is available, it is used as the headline market cross-check. The latest published physical spot observation appears with its own value and observation date underneath.
This distinction matters because the physical spot series can be published with a delay. A page refreshed today can therefore legitimately contain a physical observation from an earlier date. The Radar preserves that date instead of presenting the value as a same-moment quote.
Read the futures value as the more current market signal and the dated physical spot value as a reference for the underlying physical market. When the two diverge sharply, first check the physical observation date before interpreting the gap.
Flow Stress and Strait Risk
The fourth headline card requires the most care. Flow Stress and Strait Risk answer different questions.
Flow Stress focuses on evidence of disruption in commercial movement: throughput, vessel movements, congestion, freight conditions and related shipping signals.
Strait Risk is broader. It reflects the operating and security environment around the Strait. Risk can be high while commercial traffic is still moving, so a high risk score should not be read as proof that the Strait is closed.
If the page shows Strait Risk rather than a current Flow Stress reading, read it as an assessment of the broader operating environment rather than as a direct measurement of vessel throughput.
Read operational status separately
The operating status describes the condition of the Strait, using states such as OPEN, RESTRICTED or DISRUPTED. It is deliberately separate from the risk score.
A disrupted or restricted Strait can still have vessel movements. Conversely, an open Strait can carry unusually high commercial risk. Treating status and risk as separate dimensions avoids reducing a complicated maritime environment to a binary open/closed label.
Iran crude supply is a slower signal
The Iran Crude Supply section tracks estimates of Iranian crude production. It is not an export-volume indicator and it is not a real-time measure of Strait traffic.
The Radar can show estimates from sources such as OPEC secondary sources and the IEA Oil Market Report separately because institutional estimates do not always agree. That difference can itself be informative.
Production normally changes more slowly than vessel traffic, freight or market prices. Iran can maintain production while exports become more difficult, and shipping conditions can improve without an immediate change in production.
Use the crude benchmark table for relative pricing
The Regional crude benchmarks section expands the headline market view. Depending on source availability, it can include Iran Heavy daily references and cross-checks, the Hormuz model estimate, Oman, Brent physical spot, Brent futures, Dubai, Murban and monthly anchors.
The purpose is not to collect as many oil prices as possible. It is to make differences between markets visible.
If Iran Heavy moves materially below Brent while Oman remains closer to Brent, the divergence may be specific to the Iranian pricing environment. If Oman also develops a large premium, broader Gulf supply, logistics or risk conditions may be contributing.
Flow Conditions describe the physical market
When fresh direct information is available, Flow Conditions can show metrics such as throughput, transits, waiting vessels, war-risk insurance and tanker freight.
Throughput
Throughput describes traffic or carrying capacity relative to normal conditions. It can be more informative than a simple vessel count because ships differ substantially in size and cargo capacity.
Transits
Transit counts measure vessels recorded passing through during a defined period. They are useful only with context: ten large tankers do not represent the same energy flow as ten smaller commercial vessels.
Waiting vessels and congestion
A growing queue can reflect congestion, delayed clearances, uncertainty or operators waiting for safer conditions. Congestion can therefore deteriorate before an outright interruption in traffic occurs.
War-risk insurance
Insurance is one of the channels through which geopolitical risk becomes a commercial cost. Shipping can become materially more expensive while the route remains operational.
Tanker freight
Higher tanker rates can reflect tighter vessel availability, delays, longer voyages, stronger demand or higher operating risk. Freight can therefore signal stress before a complete physical disruption occurs.
The Market Signals strip is the fastest diagnostic layer
The current Radar adds a compact Market Signals layer to the daily Strait assessment. It tracks five dimensions:
- Commercial transits
- Tanker freight
- War-risk insurance
- Congestion
- Energy flow
Each signal has a state and a direction. The state describes current pressure, while the direction indicates whether conditions are improving, stable or worsening where the evidence supports that conclusion.
The important point is that these are not five versions of the same indicator. They can diverge. Freight and insurance can rise while vessel flows remain relatively stable; congestion can ease while security risk remains high. Those divergences are often more informative than a single composite score.
Where a reliable current signal cannot be established, the Radar can show UNKNOWN rather than infer a precise condition from weak evidence.
Always check the observation date
Several indicators on the Radar include an observation or publication date. That date is part of the data and should be read with the number.
This is especially important for physical oil benchmarks and shipping indicators, which do not all update at the same frequency. A physical Brent observation, for example, can be older than the futures quote shown alongside it.
Use older observations for context, not as if they were live readings. For fast-moving conditions, give more weight to indicators carrying a recent observation date and compare them with the broader status, risk and market signals.
If a field is unavailable, do not treat the absence itself as evidence of improvement or deterioration. Read the remaining indicators and the daily brief instead.
The daily Strait Radar brief adds context
Quantitative data alone cannot explain every change around the Strait. The daily Strait Radar brief monitors current developments and focuses on changes with potential commercial consequences.
It considers issues such as maritime incidents, official notices, changes in commercial operations, insurance and freight conditions, congestion, energy flows and temporary routing arrangements.
The brief is intentionally selective. It is designed to identify the developments that materially change the operating picture rather than reproduce every related headline.
Market Implications answer the “so what?”
The Market Implications section translates developments into possible consequences for crude pricing, petrochemicals, shipping, freight, insurance, Gulf logistics, importers and exporters.
A maritime incident may matter because insurance costs rise. Lower transits may tighten tanker availability. A change in routing may increase voyage time. A security escalation may affect regional crude spreads before export volumes visibly change.
These are analytical implications, not forecasts of a guaranteed market outcome.
What to Watch Next is a monitoring checklist
The Next 7 Days section identifies developments that could materially alter the current assessment. It is not intended as a prediction engine.
Relevant triggers can include a new official maritime notice, a measurable change in commercial traffic, changes in insurance or freight conditions, new incidents, easing congestion or evidence that operators are changing their behavior.
Use spreads to separate global and regional stress
Relative price signals such as Iran / Brent, Oman / Brent and Iran / Oman help distinguish different market forces.
The Brent leg of these spread calculations uses the physical spot reference. Because that observation may lag the futures market, always check its date before treating a large spread as a same-moment dislocation.
If Brent, Oman and Iran Heavy move by very different amounts, the divergence can help show whether pressure is global, Gulf-specific or more concentrated in the Iranian market.
A practical reading order
A useful way to read the Radar is to move through it in four steps.
- Check operational status and risk. Establish whether the Strait is operating normally, under restriction or under material disruption, and how severe the broader risk environment is.
- Read the Market Signals. See where stress is actually appearing: transits, freight, insurance, congestion or energy flow.
- Compare Iran Heavy, Oman and Brent. Determine whether physical and maritime stress is also appearing in regional crude pricing.
- Read the daily brief and Next 7 Days. Identify what changed, why it matters commercially and which developments could change the assessment next.
If several independent layers deteriorate together, the evidence of broader stress becomes stronger. If they diverge, the divergence deserves investigation rather than being forced into a single narrative.
The Radar is a monitoring system, not a binary alarm
Conditions around the Strait of Hormuz can deteriorate through several intermediate stages: higher perceived risk, more expensive insurance, operator caution, rising freight, congestion, slower traffic, restricted operations and, in more severe cases, physical disruption.
The purpose of the Hormuz Strait & Energy Radar is to make those intermediate signals visible without treating every warning as a closure or every market move as proof of physical disruption.
For companies exposed to Iran, Oman, Gulf energy markets or regional supply chains, the more useful question is usually not simply “Is the Strait open?” It is “Where is stress appearing, how is it changing, and what does that change for trade?”